Phases of the project
Data Discovery, Extraction, Integration, Analytics, Validation, Reporting and Visualization
Data Discovery
Collected data about the city of Chicago from various sources. It included data about weather, demographics, census, crimes, business licenses, food inspections and restaurants.
The major sources used for gathering data are:
Yelp
After data gathering, data abstraction was performed to determine what data is about, its attributes and relationships which helped in understanding more about the data.
Data Extraction
From the collected data, only the data for zip codes from 60601 to 60607 was extracted and used in the further tasks.
Data Integration and Analytics
In this phase of the project, datasets were integrated and analyzed to determine different trends and patterns in the data. Some of the queries that this phase helped in answering were:
● Types of crimes within 3 blocks of grocery stores, schools and restaurants
In this the Business and Crimes data sets are combined on the basis of census tract. By performing aggregations, the number of crimes and arrests have been computed for a particular business types. For visualization purpose, the business types are shown using different colors and the opacity of colors represents the number of crimes within 3 blocks of that business. To get additional details about the crime types, when the user clicks on the data point the plot on the right gets updated to show crime distribution on the basis of type.

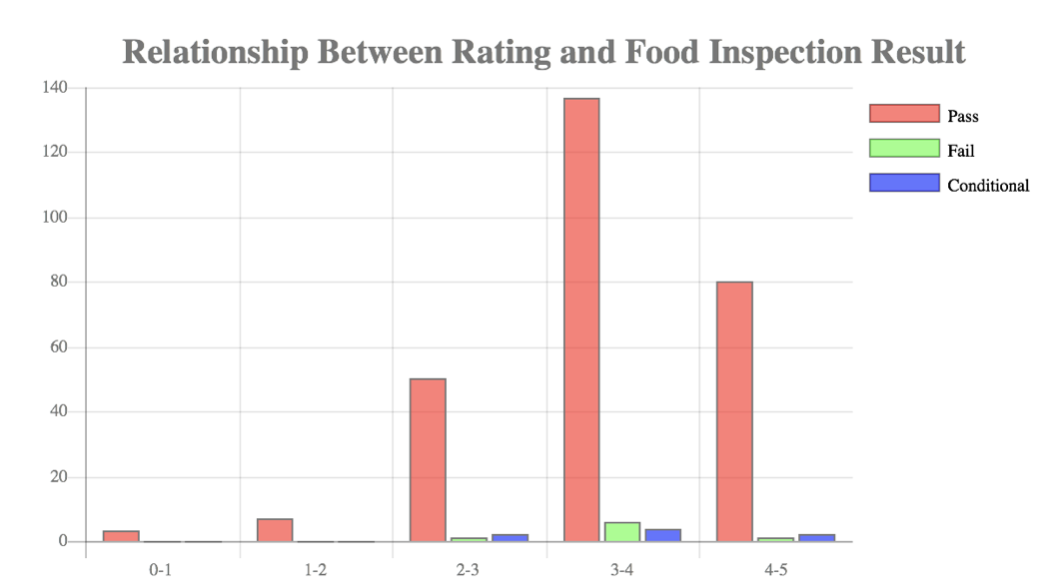
● Relationship between average review rating and food inspection result for a restaurant
This query combines the yelp and food inspection data. The average rating is divided into 5 intervals. For each interval, the bar graph represents the count of restaurants classified by pass, fail and conditional.
● Sentiment analysis of yelp reviews for each restaurant
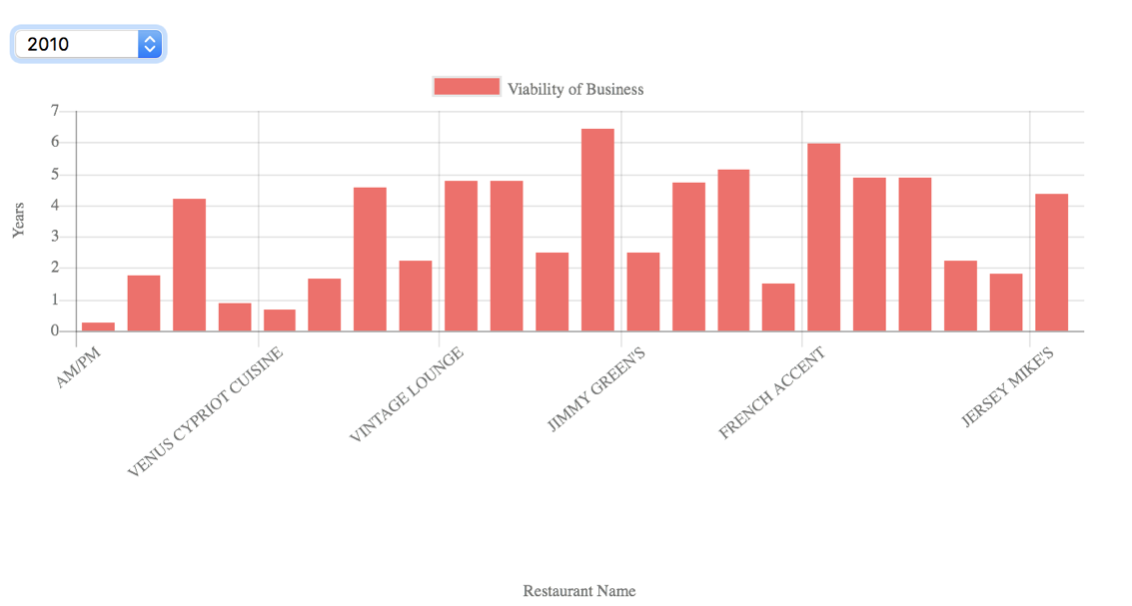
● What is the viability of a business, i.e., how long is a business active, after a failed food inspection?
The results are obtained by combining the Business License and Food Inspection data sets on the basis of License number field. For each of the restaurants, then the difference between the Inspection date and License Status Change Date is calculated to get the age of a restaurant after the inspection. The bar graph represents the age of the business after a failed food inspection.
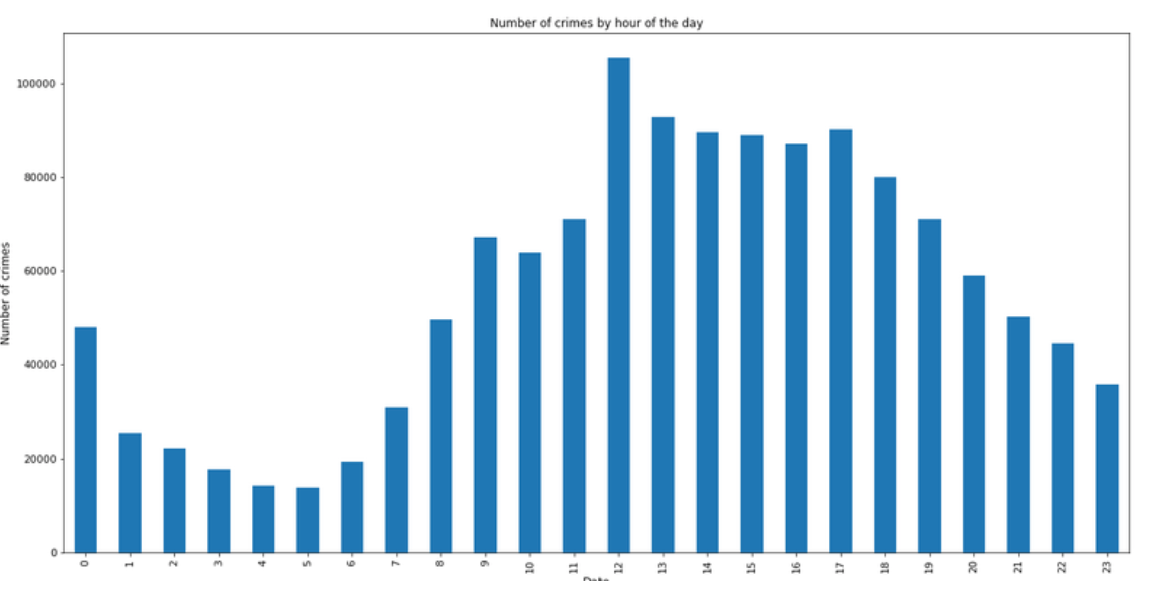
● Prediction of robbery for summer 2018
This query uses weather data recorded at weather station near Midway and the crimes data from city of Chicago data portal. The data for both the datasets ranges from year 2001-2018. On examining number of crimes by hour of day shows that frequency of crime is at its lowest at 5 AM in the morning. This is likely because in the early morning hours most people are sleeping or at home. Crime steadily increases from the low point at 5AM and reaches it maximum level at 12 PM. The spike in crime at 12 PM, which is largely driven by a high incident of theft during this period.
Validation and Testing
Random Forest was used for crime prediction. Using Random Forest we predicted Robbery type for summer with an accuracy of 92% and for a given address we predicted crime type (without considering weather data) with an accuracy of 94%.We obtained this accuracy on train and test dataset ratio of 80:20.
Other ML models we tried were: Decision Tree - 92% accuracy without weather data and 90% with weather data.
Visualization and Reporting
The results were presented in the form of visualizations. A combination of static and dynamic graphs was used to convey the results. The tools used for visualization are: Chart.js, OpenStreetMap(OSM), Matplotlib and Seaborn.
Team
Keshav Malpani
Yashika Goyal
Jaspreet Kaur Sohal
Santhosh Mani