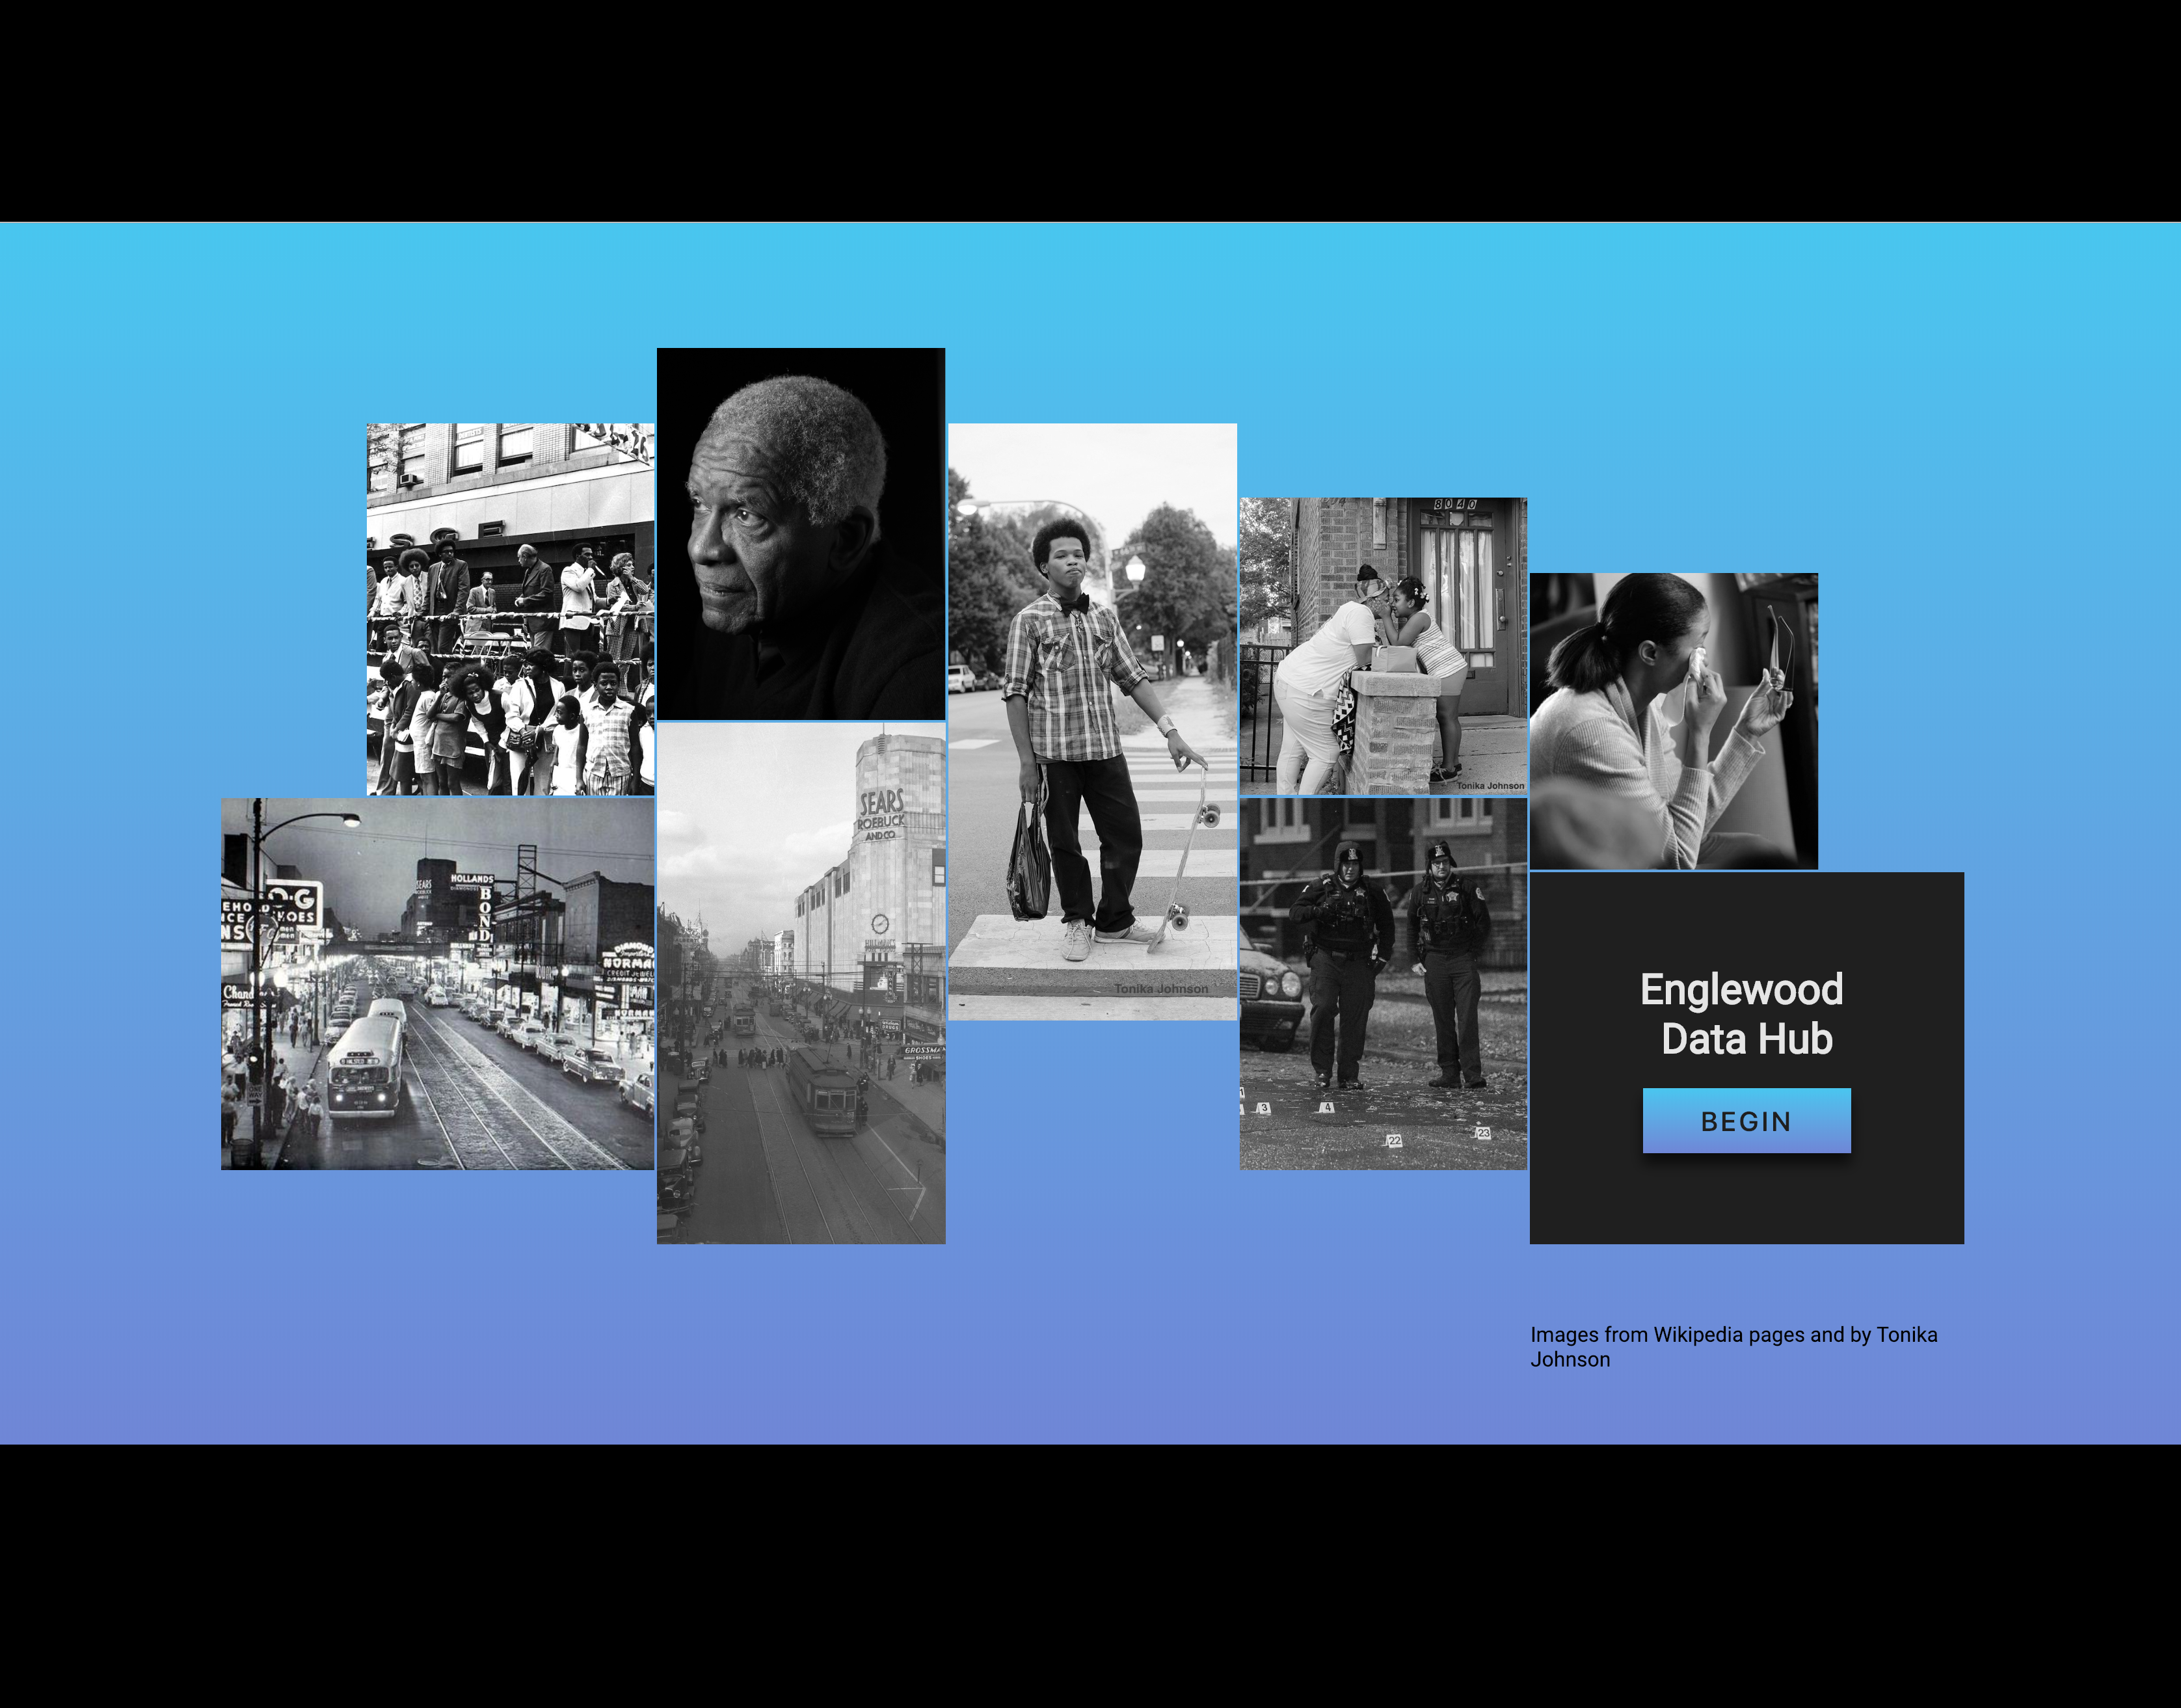
Englewood Data Hub
Analytical tool for assessing social services, demographics and crimes data in Englewood. This project was completed at University of Illinois at Chicago as a part of Visual Data Science graduate course in Fall 2018.
2018
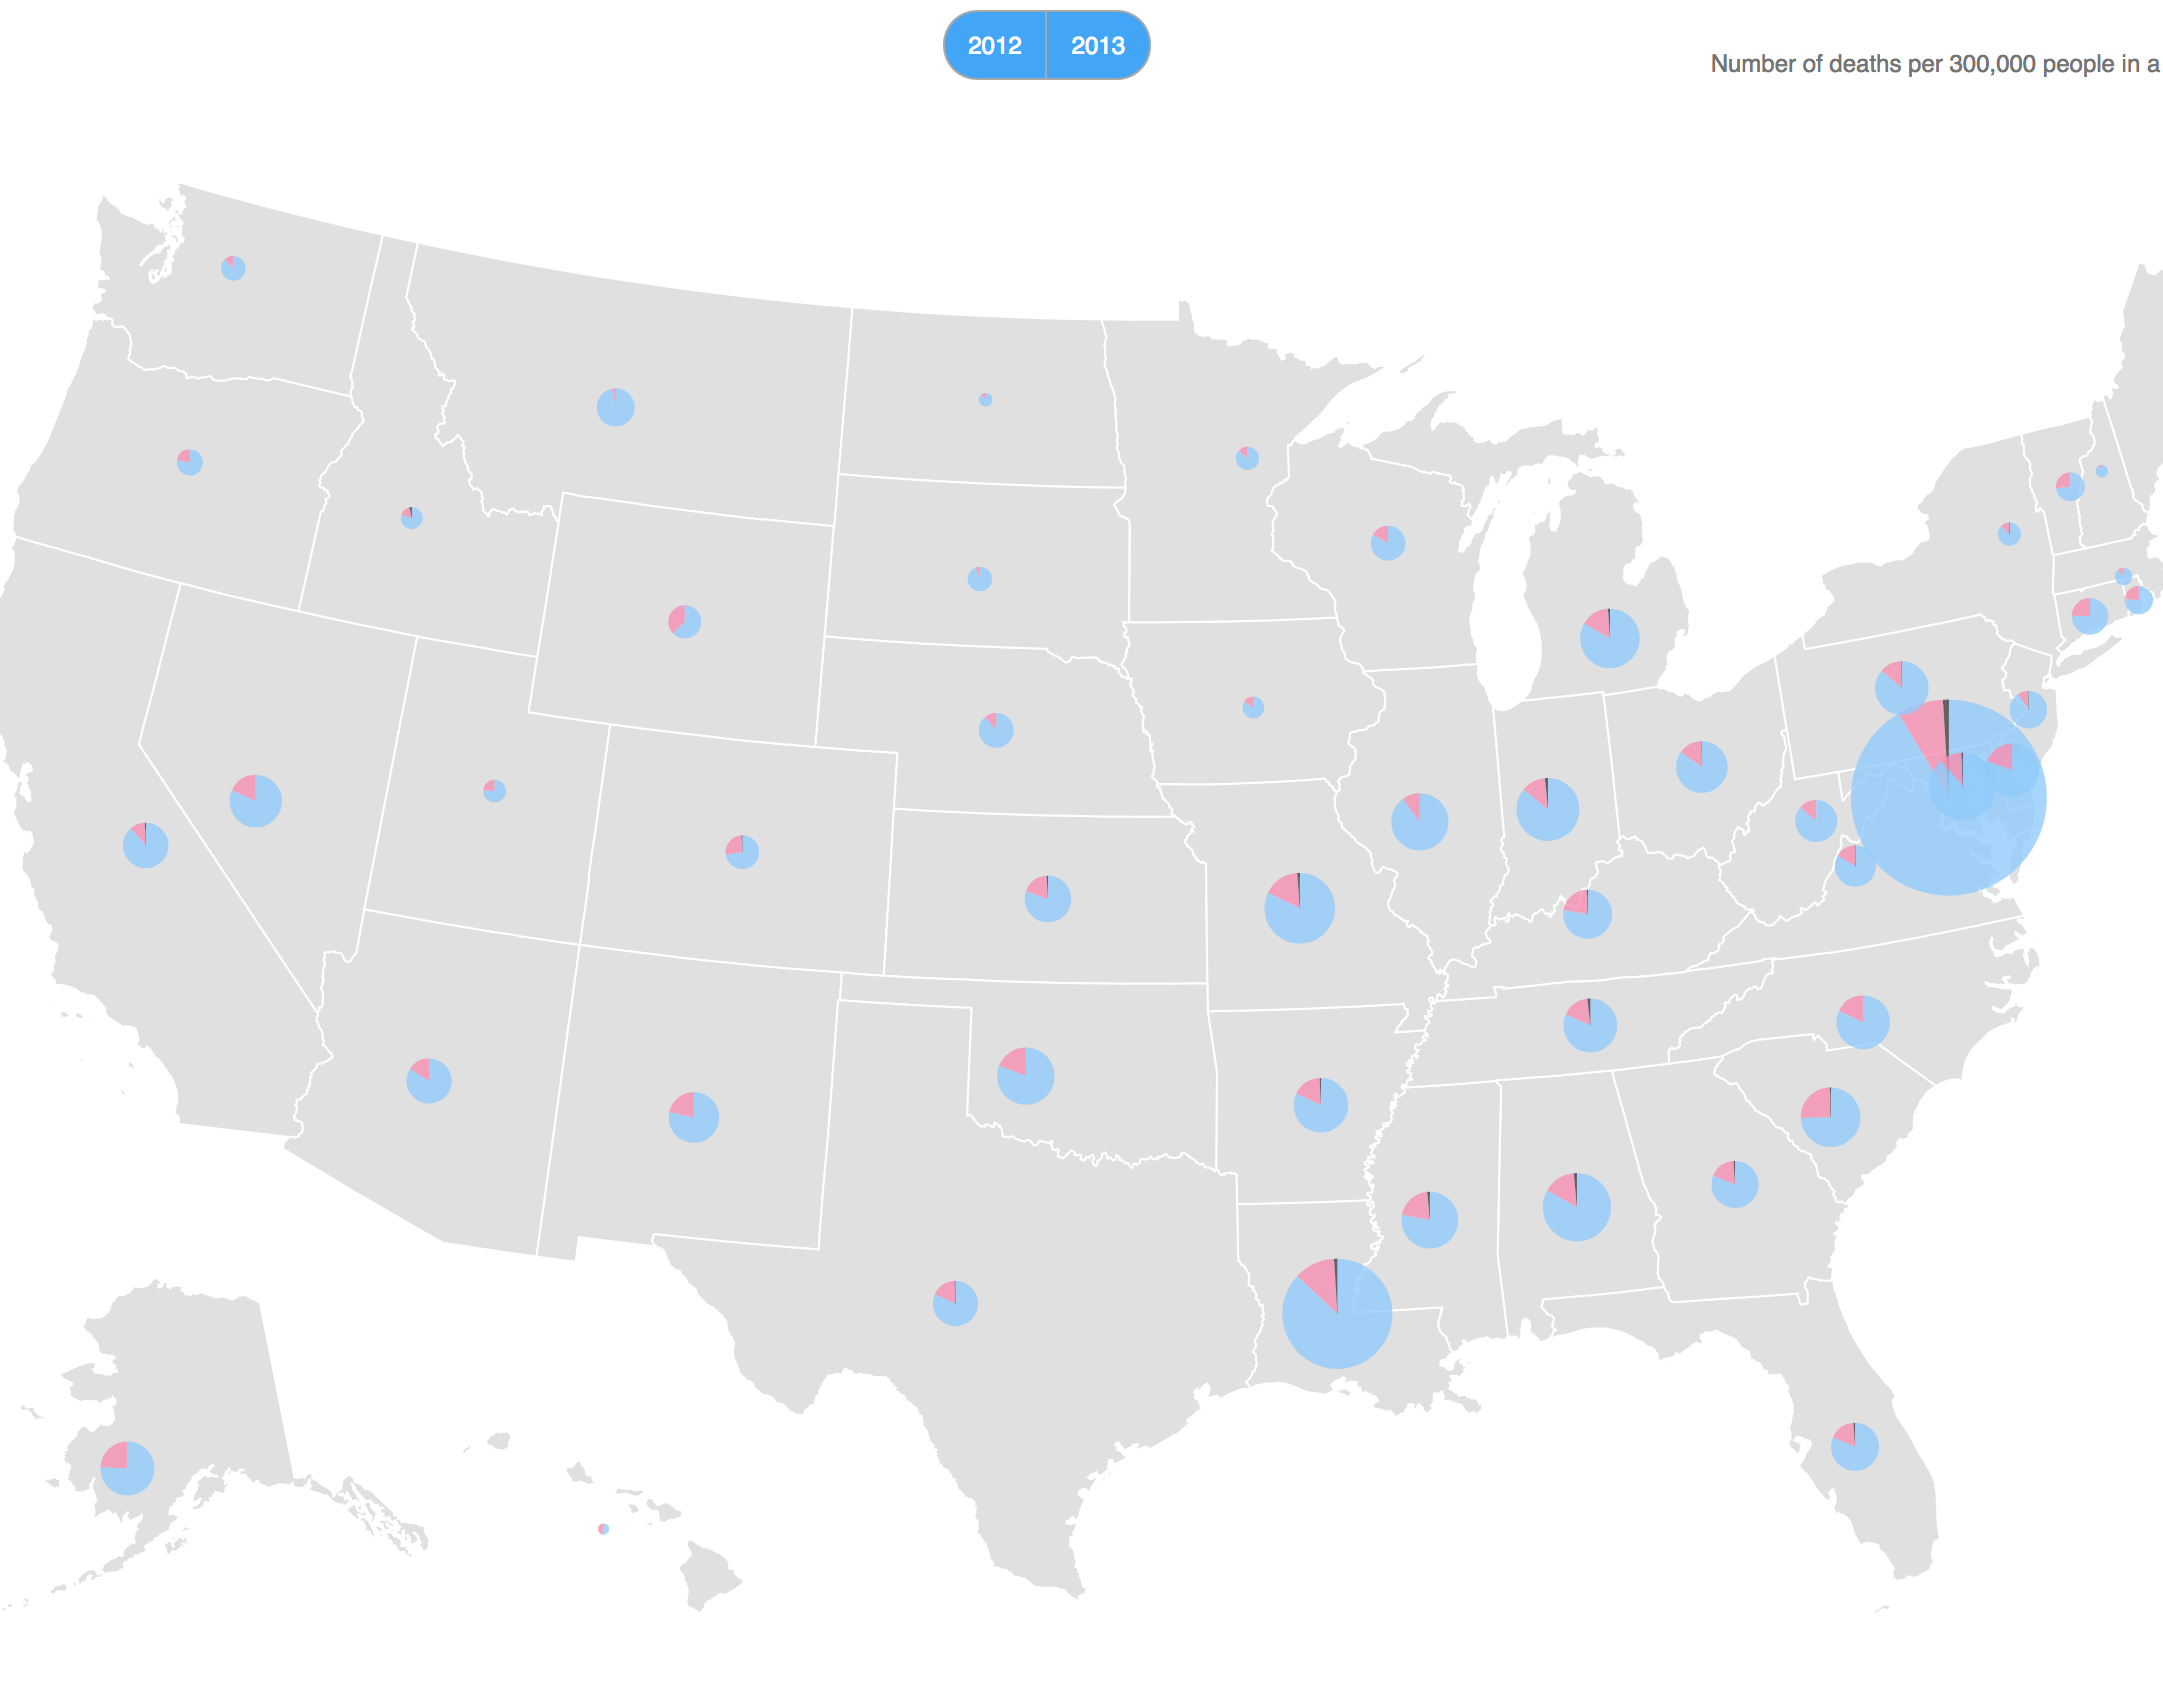
How Many People Have Been Killed By Guns Since Newtown?
"Gun violence in United States results in tens of thousands of deaths annually."
And these fatalities has been growing every year. This visualization draws a picture of gun violence in United States for December, 2012 - December, 2013.
2018

You Spin Me Round
GeoSpatial Visualization of Tornadoes in US from 1950-2016
2018
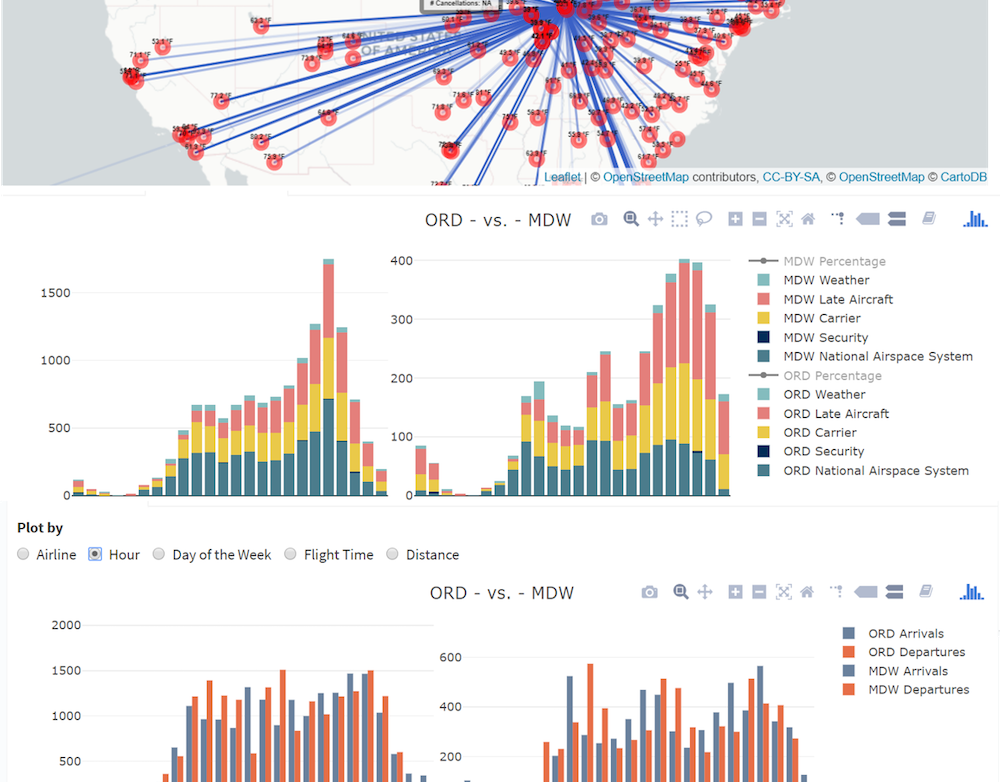
Learning To Fly
Interactive Visualization of Flights in Illinois 2017
2018
Don't Go Near The Water
Recreation of John Snow's visualizations for the 1854 London Cholera Outbreak in Soho District.
2018
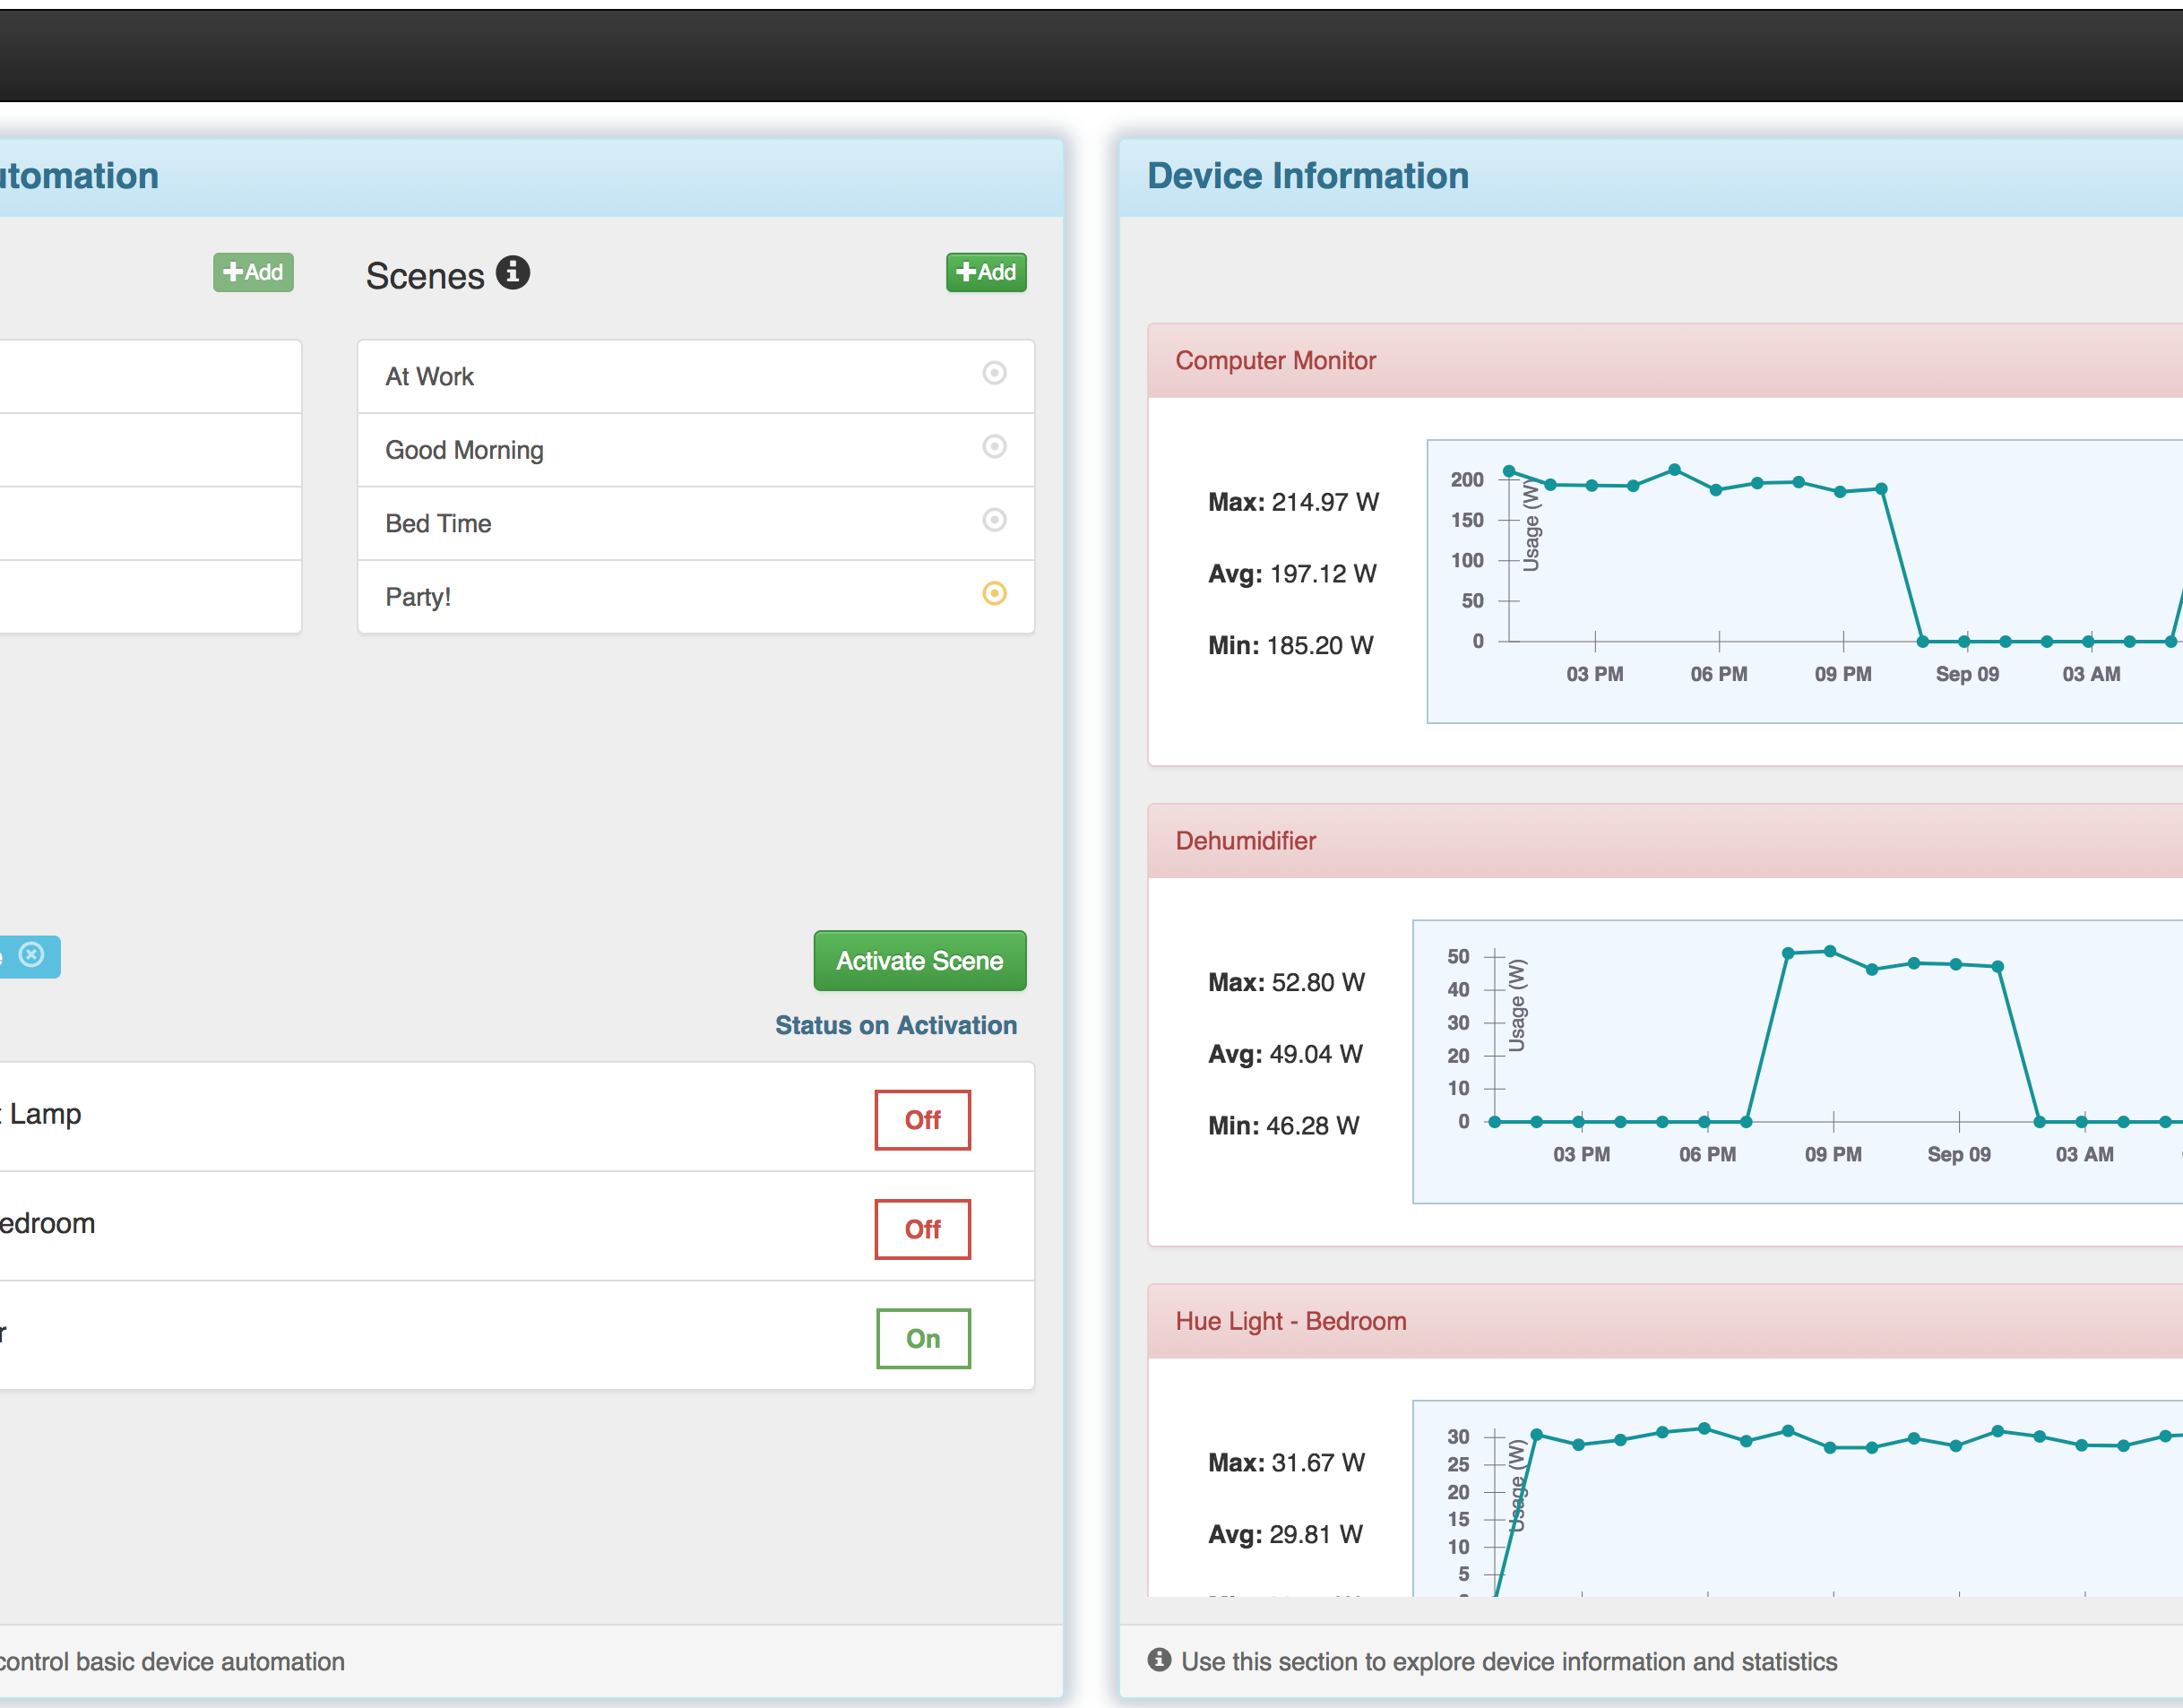
IoT Command Center
User interface design to manage IoT devices
2018
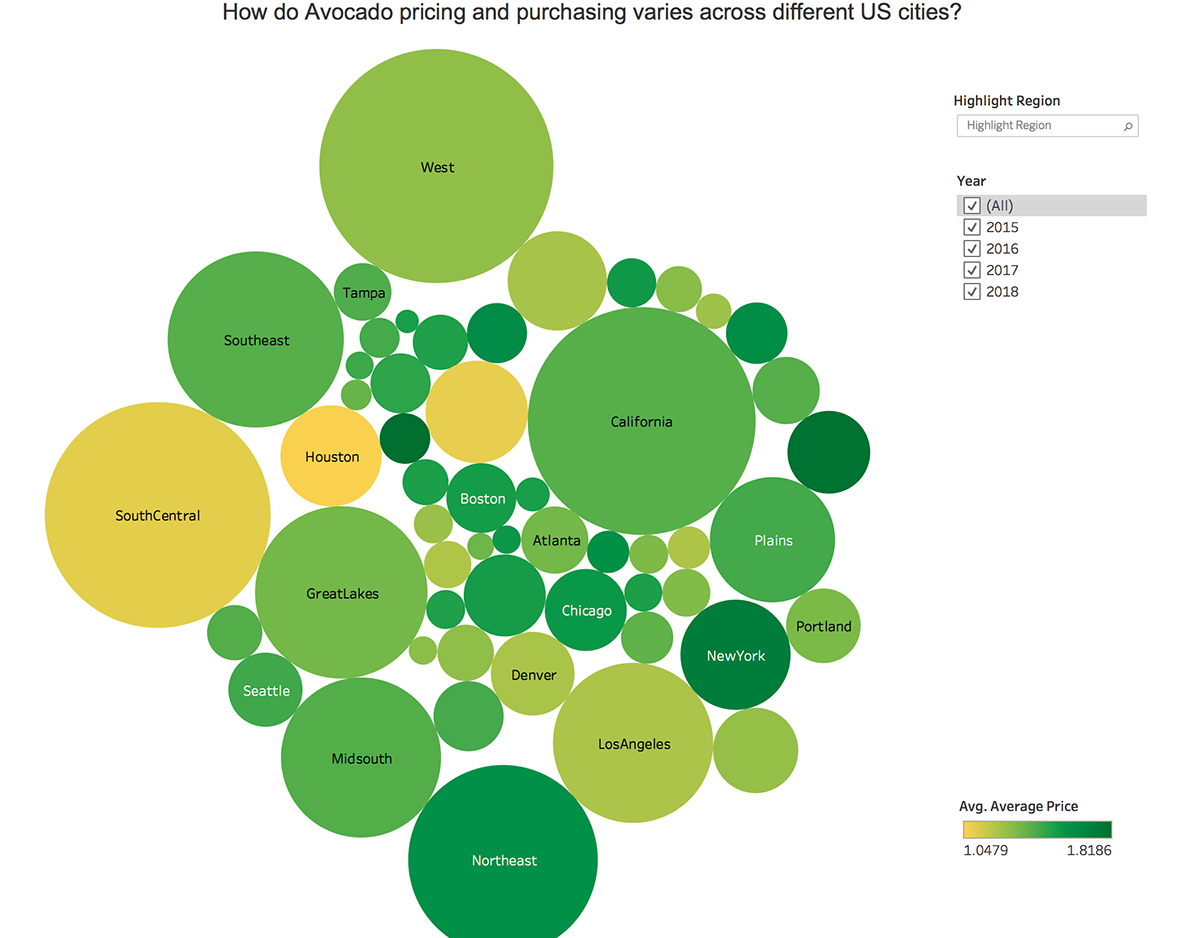
Hass Avocado
Visualizing Hass Avocado data
2018

75ºF with chance of snow
Data Science project with main objective of going through the data science pipeline.
2018