This application shows the interactive visualizations for airline flights within Illinois for 2017. Some of the tasks which can be performed using this application includes:
● View statistics of airports either individually or compare the data of two airports.
● Dig deeper to get more information about the airport on the basis of date, airline, day of the week, month, number and type of delays.
● Change the preferences of the Measurements (km|miles) and Time Format (12hr|24hr).
Data
The Bureau of Transportation Statistics publishes on-time arrival data for non-stop domestic flights by major air carriers. This application looks at all flights flying in/out of Illinois in 2017.
The OpenFlights Airports Database contains over 10,000 airports, train stations and ferry terminals spanning the globe, as shown in the map above. We use IATA code to obtain geo-location and timezone data for each IL airport.
The National Oceanic and Atmospheric Administration (NOAA) provides access to Global Historical Climatology Network (GHCN), which provides daily, monthly, and yearly temperature, precipitation, and snow records over global land areas. We have used the GHCN-Daily data for 2017 to determine the closest weather station to each airport in the US.
How to use application
The application can be navigated using the sidebar with five options of Home | Compare Airports | Deep Dive | States | Preferences.
Home
Home provides the description of the project and the team members. It also includes an overview of 10 interesting days for air travel in 2017.
Compare Airports
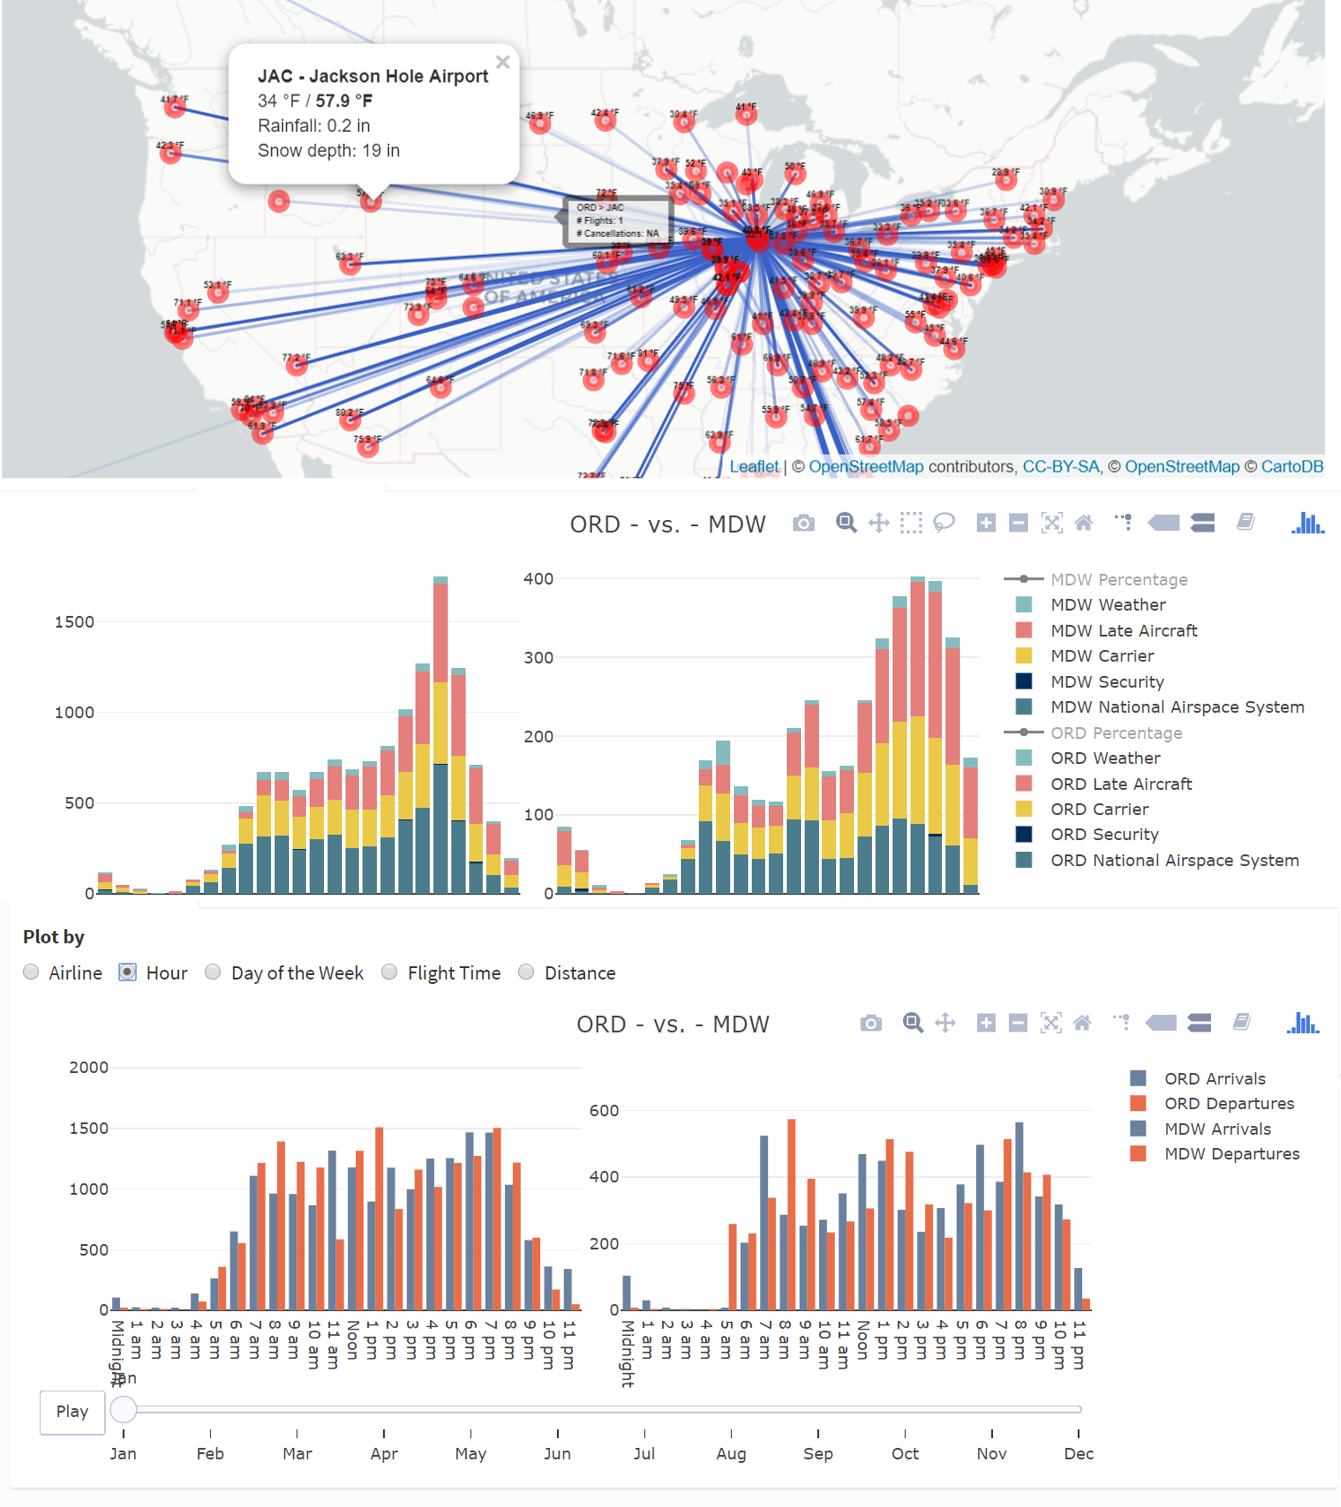
Compare Airports allows the user to view data from two airports across months by filtering the data using different parameters. The user can toggle between the plots and tables for the data. In addition to that user has the ability to change the mode of the plots from Grouped plots to Stacked plots. Also user can either focus on two airports individually or compare their data using the "Compare" checkbox. For the two airports selected by user, he/she can view the following data:
Number of Flights: Displays the number of Arrivals and Departures which can be explored by Airlines , Hour, Day of the Week, Flight Time and Distance.
Number of Delays: Number of delays by type of delay along with the percentage of total number of delays over total number of flights.
Top 15 Destinations: Displays the numbers for the most common 15 arrival and destination airports.
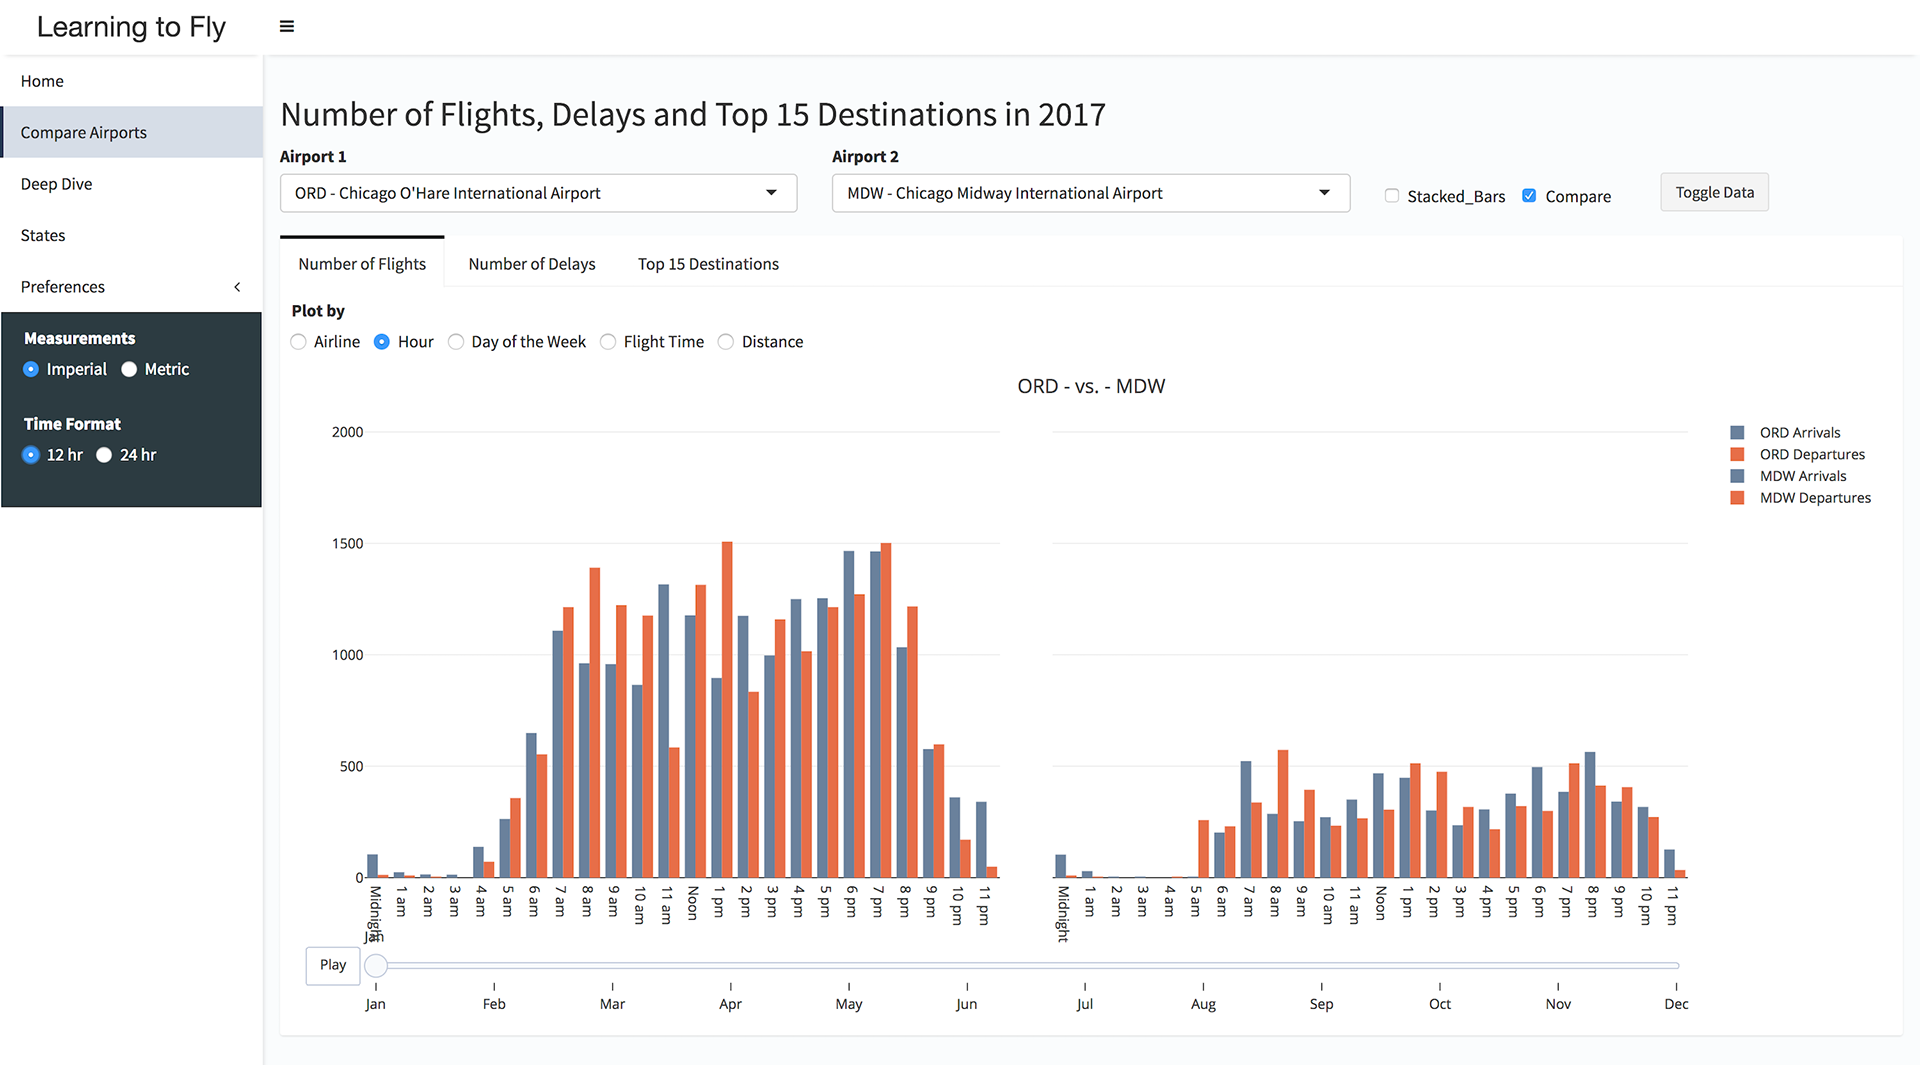
Compare Airports allows users to analyze statistics for two airports based on number of flights, delays and top destinations
Deep Dive
Deep Dive provides further insights of the data for a chosen source airport across months. The user can view the graphs as well as the maps (heatmap or leaflet map) for all the statistics. In addition to that the user can get data for Date | Target Airport | Airline | Day of the Week.
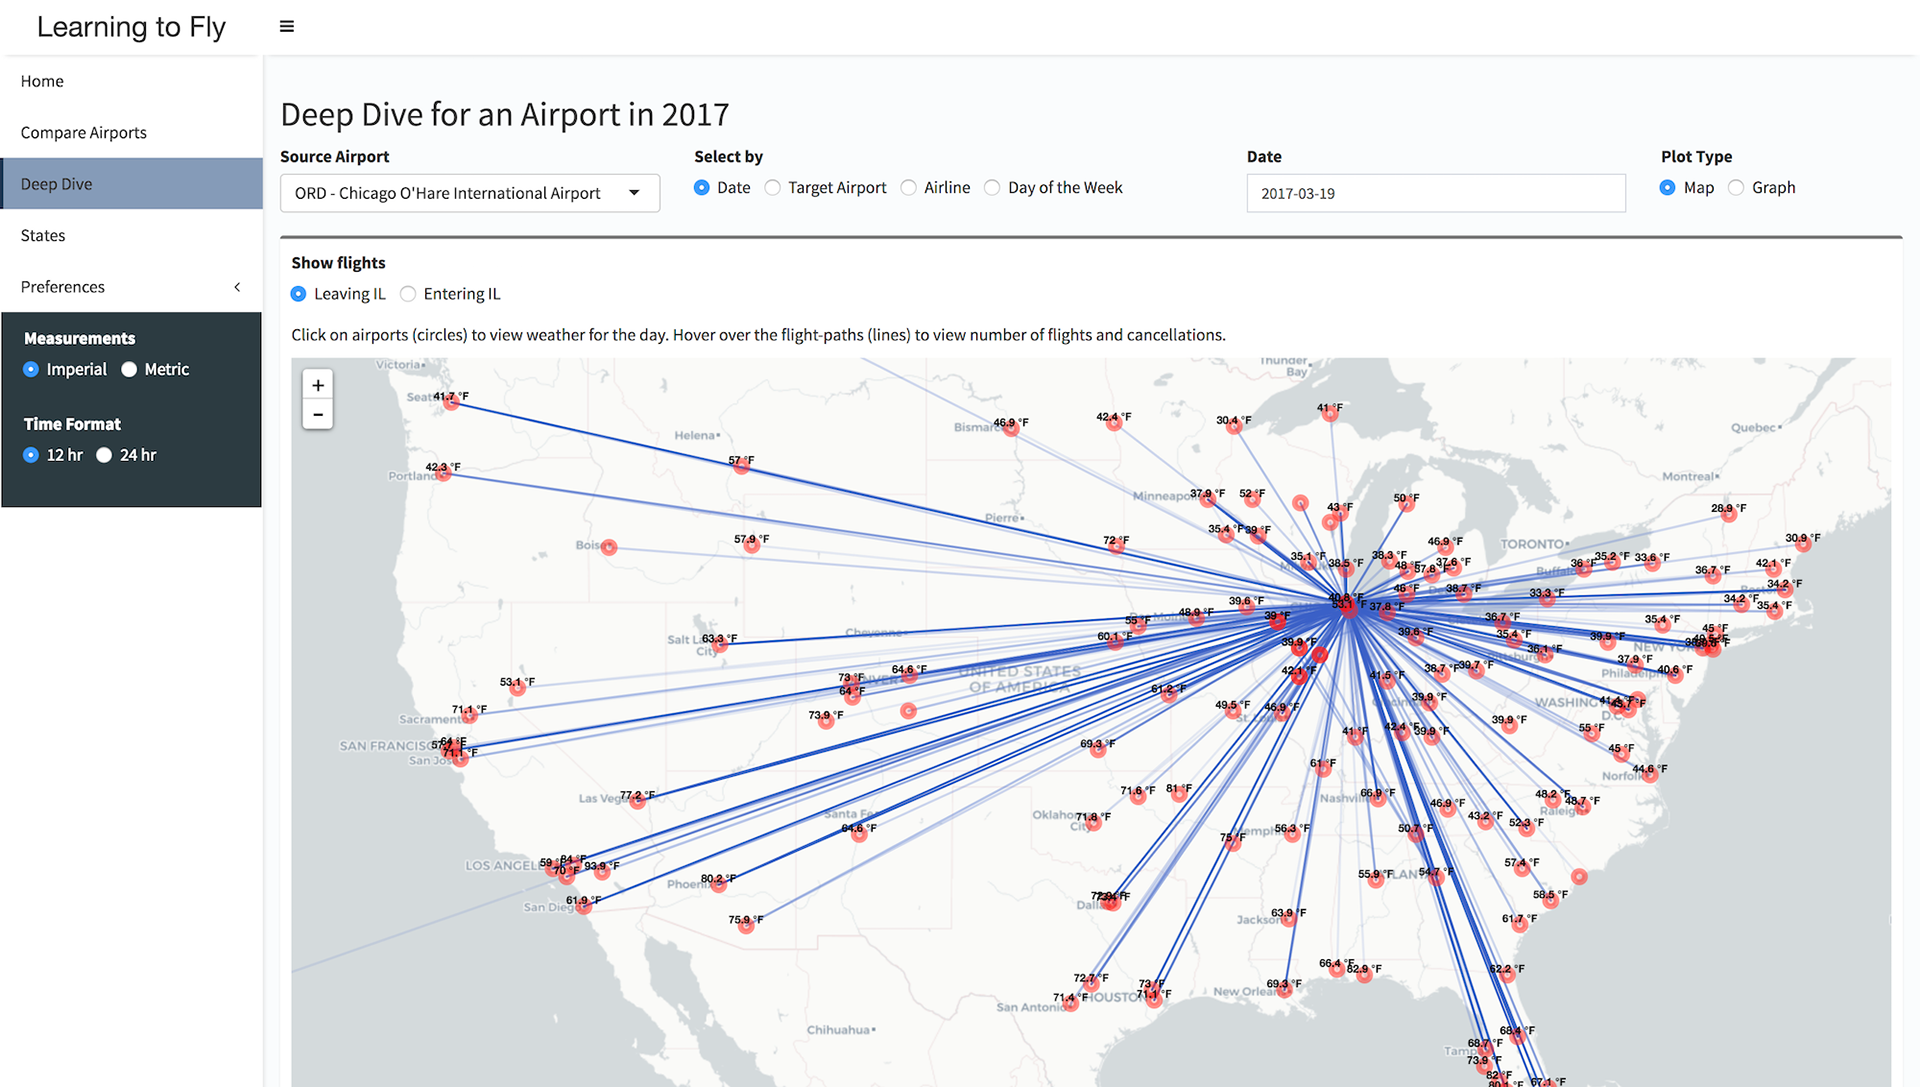
Deep Dive provides in-depth insight into the statistics for a particular airport
States
States component contain the hexagonal map showing information about the flights between Illinois and different states within US.
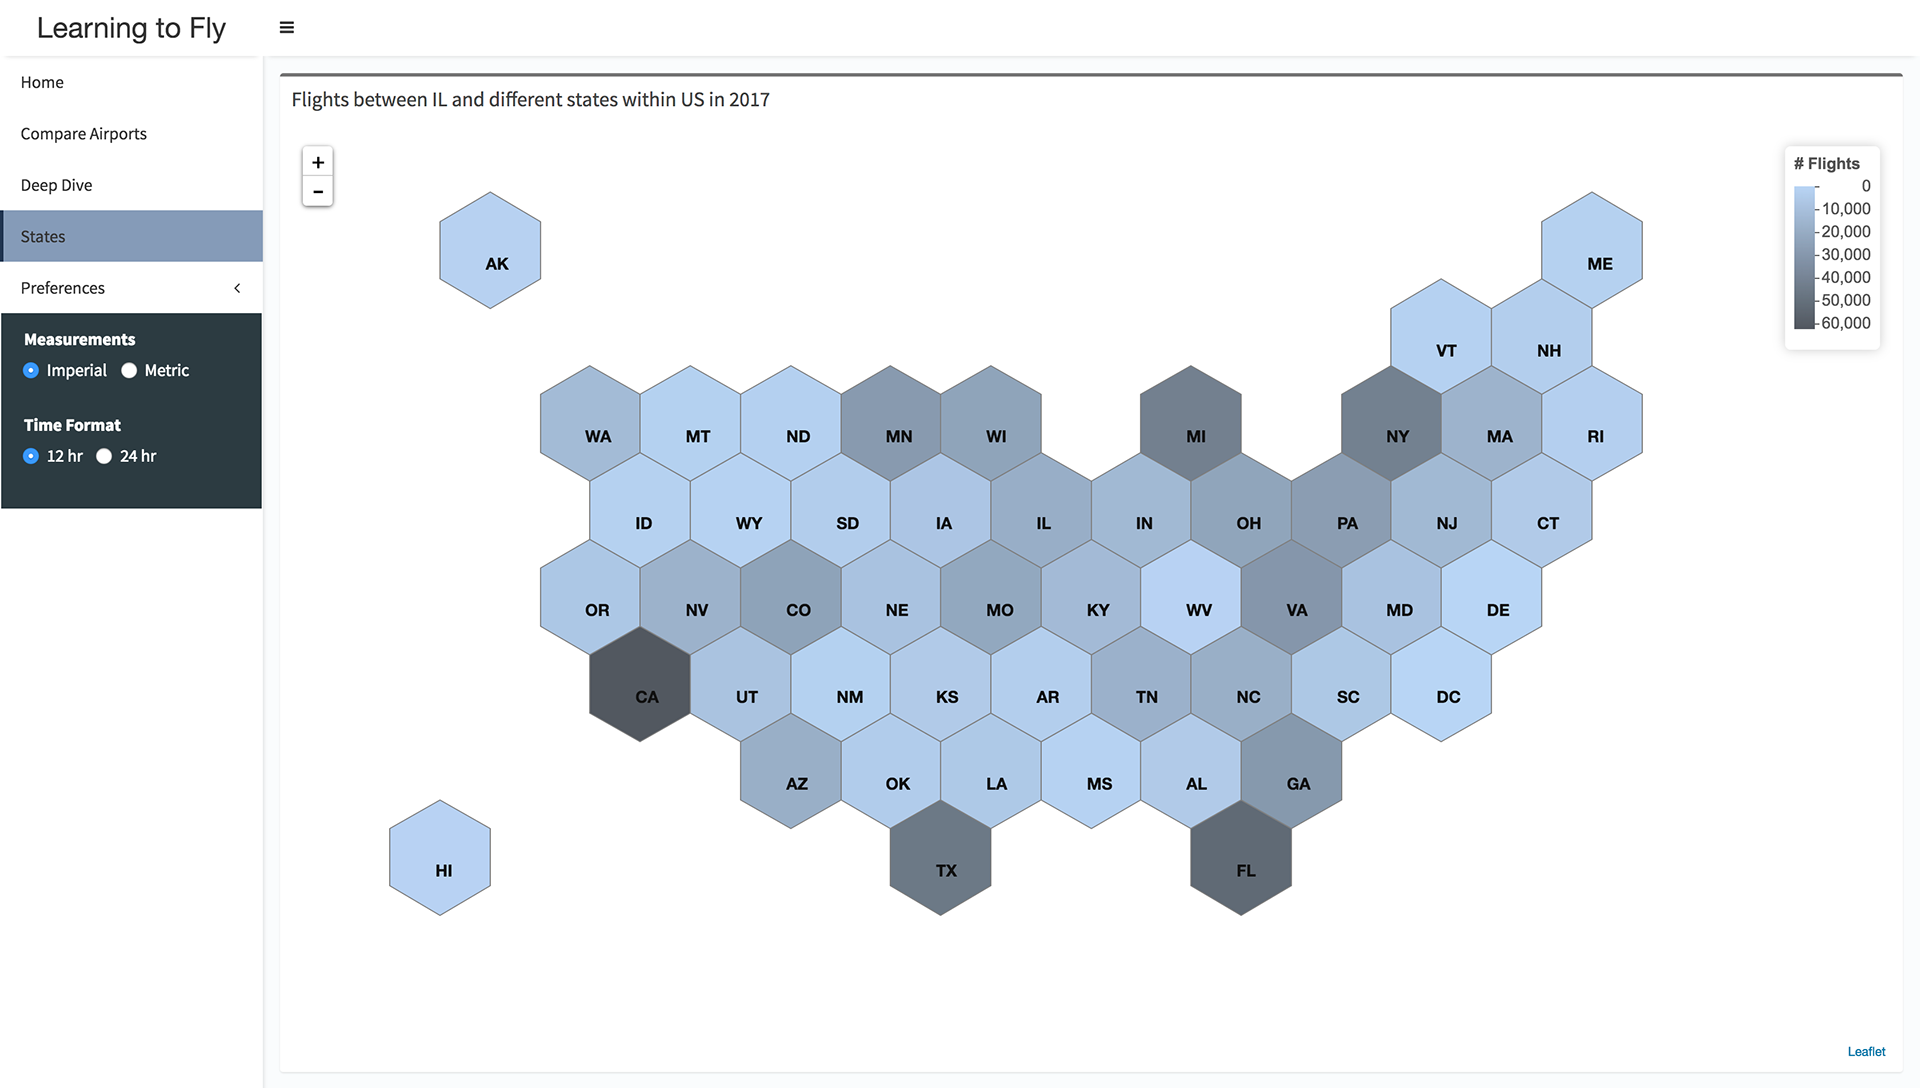
Overall distribution showing flights between Illinois and different states within USA
Preferences
Preferences allows the user to switch between Measurements(km|miles) and Time Format(12hr|24hr).
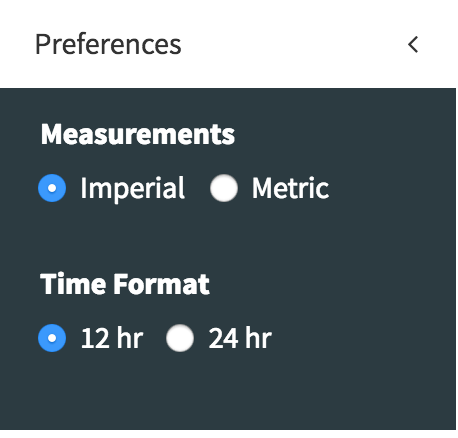
Controls for adjusting Preferences
Insights
On 3/14/2017, there was a heavy snowfall that caused the most number of flight cancellations. Support
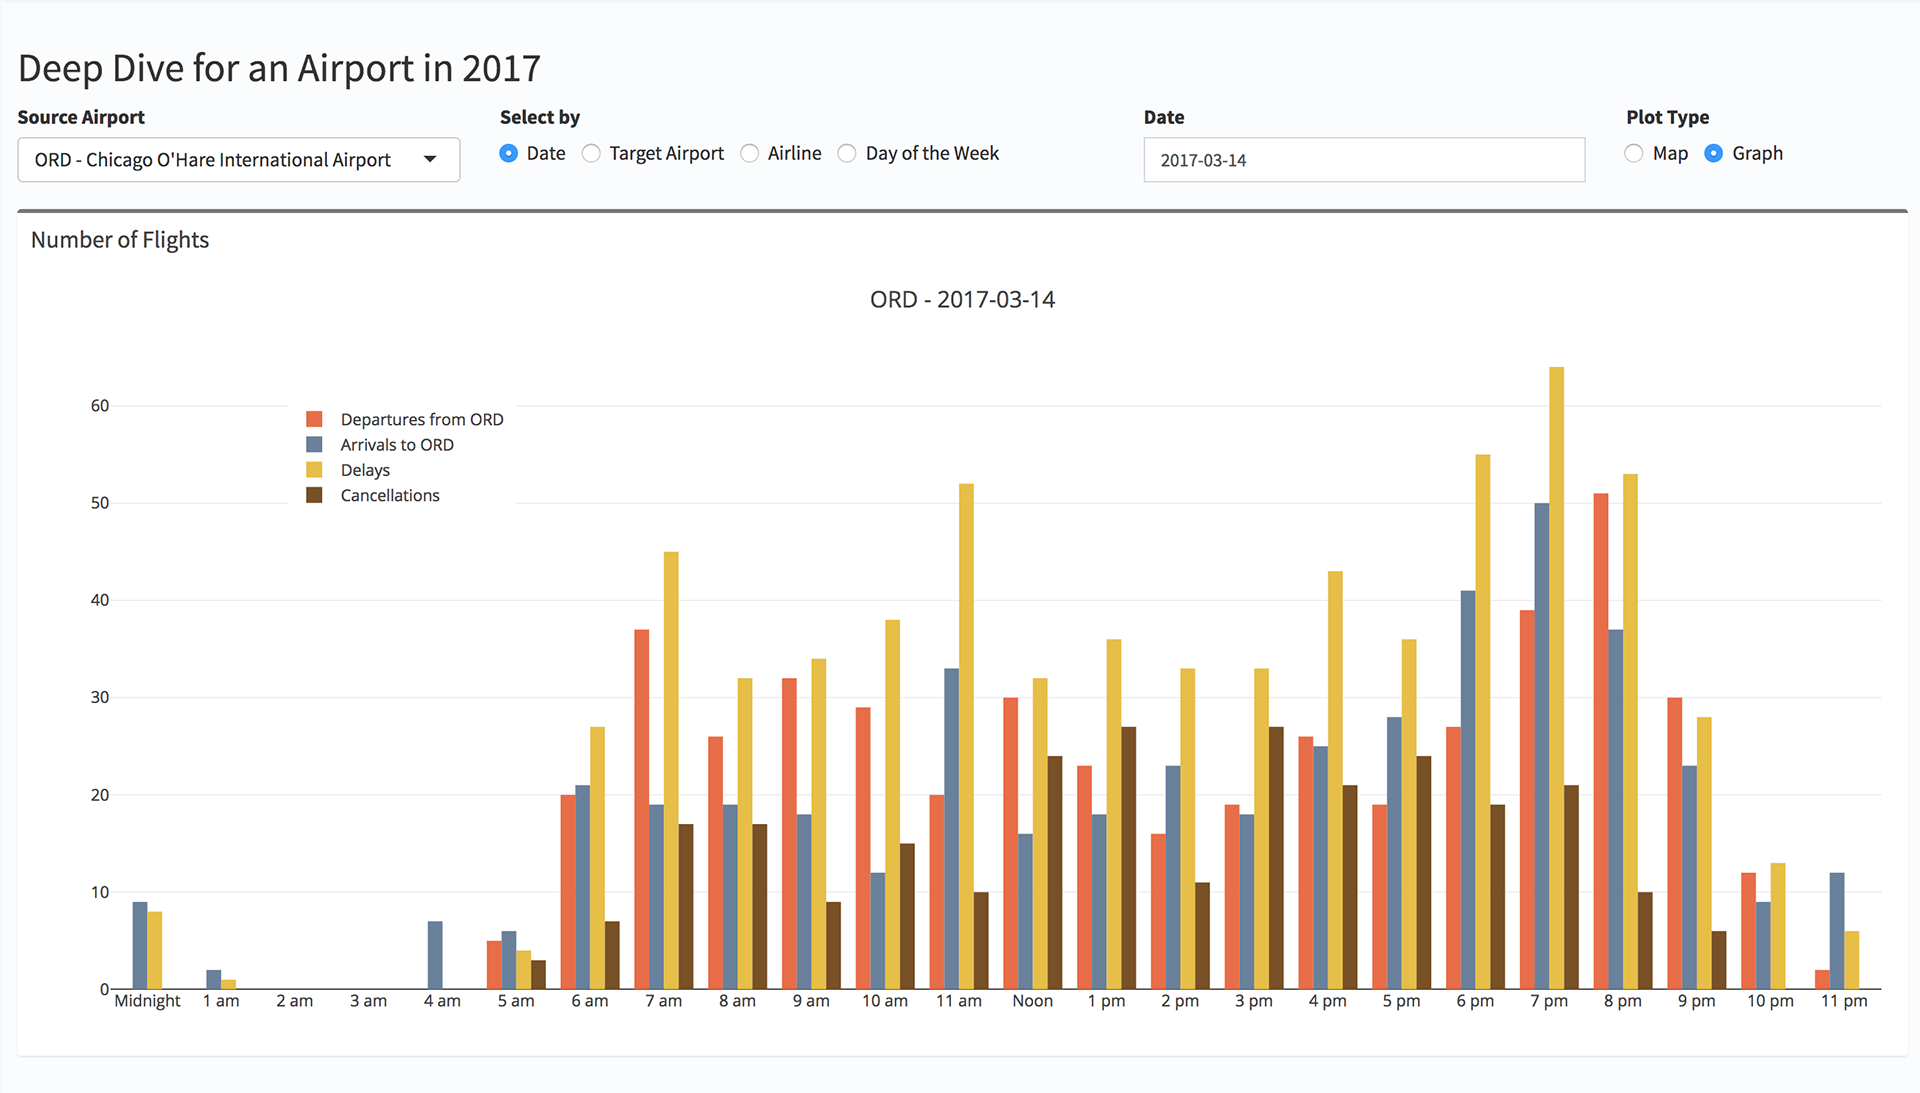
Large number of flight cancellations due to heavy snowfall
There is a sudden increase in number of flights between O'Hare International Airport and San Diego International Airport possibly due to the introduction of a new flight.
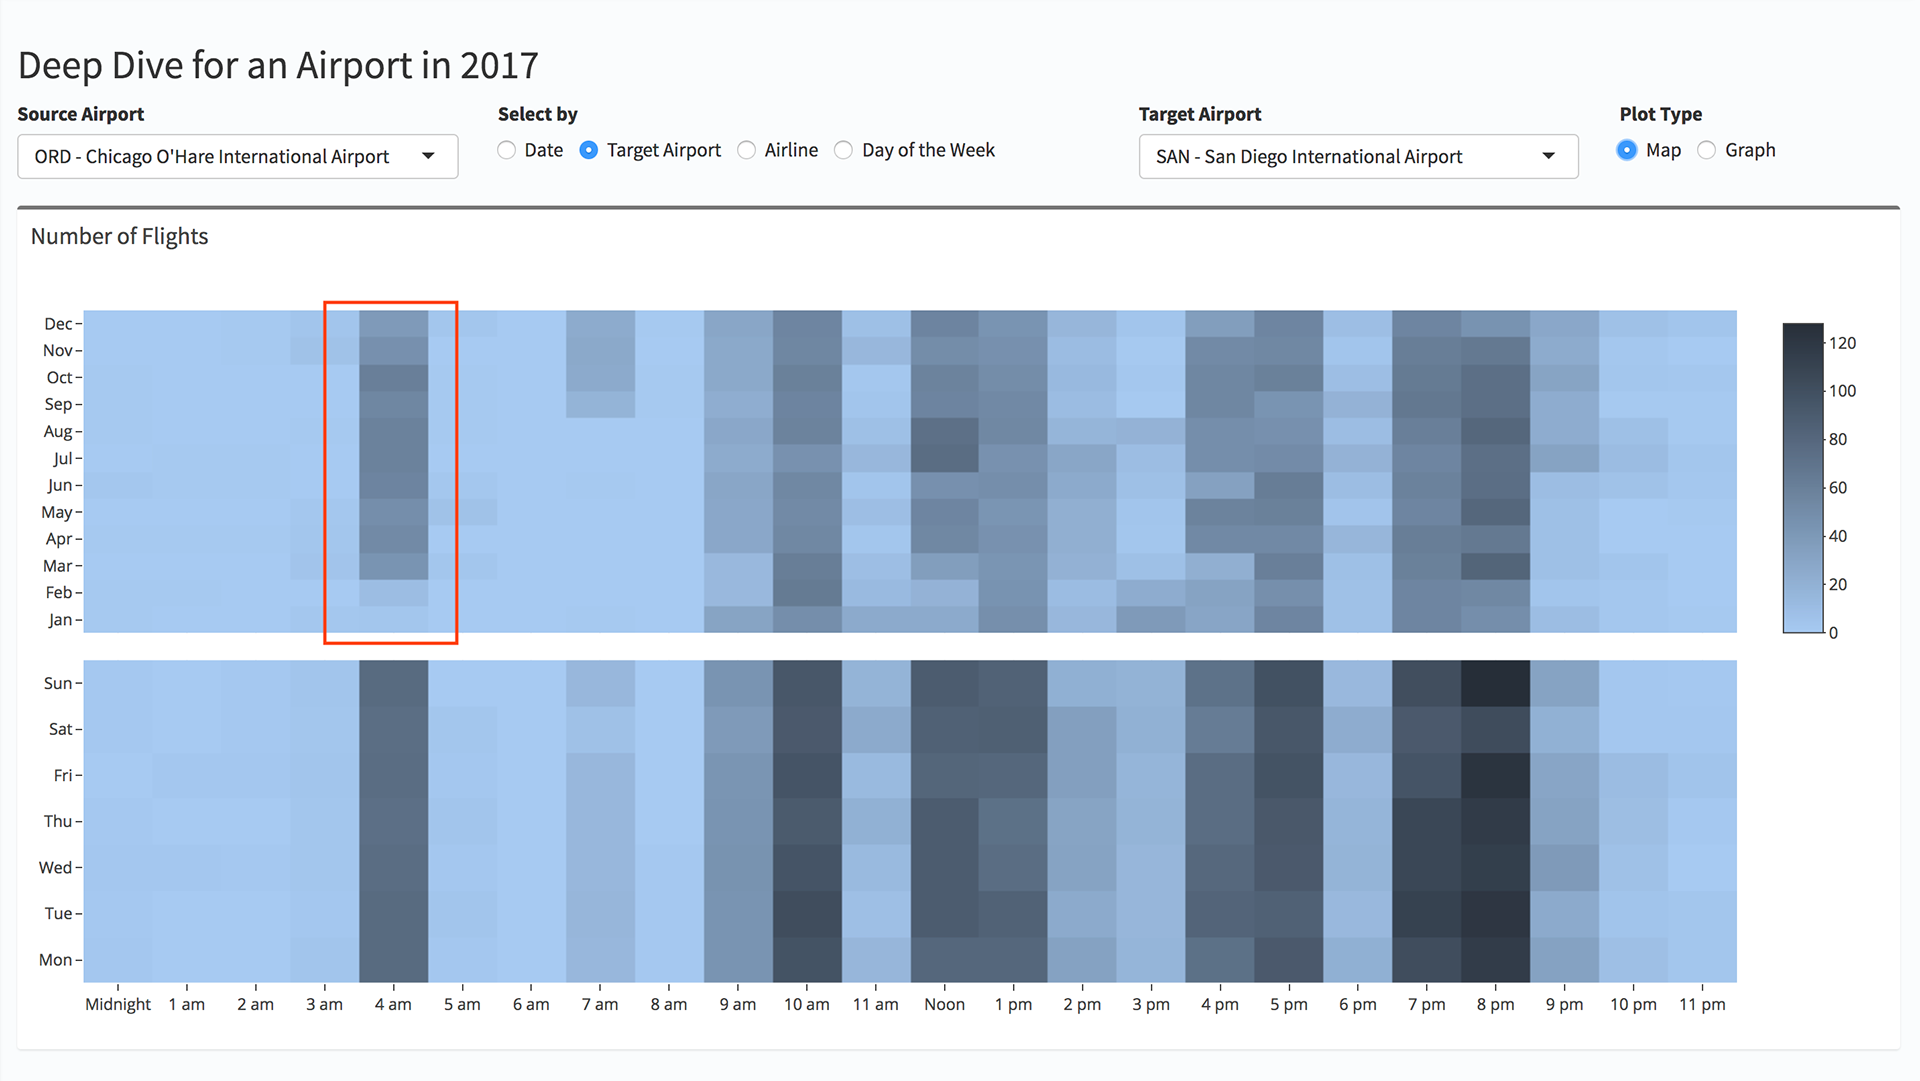
Highlighted region showing sudden increase in number of flights in the month of March from O'Hare to San Diego International Airport
During second week of September 2017 almost all the flights to Florida were cancelled due to hurricane Irma
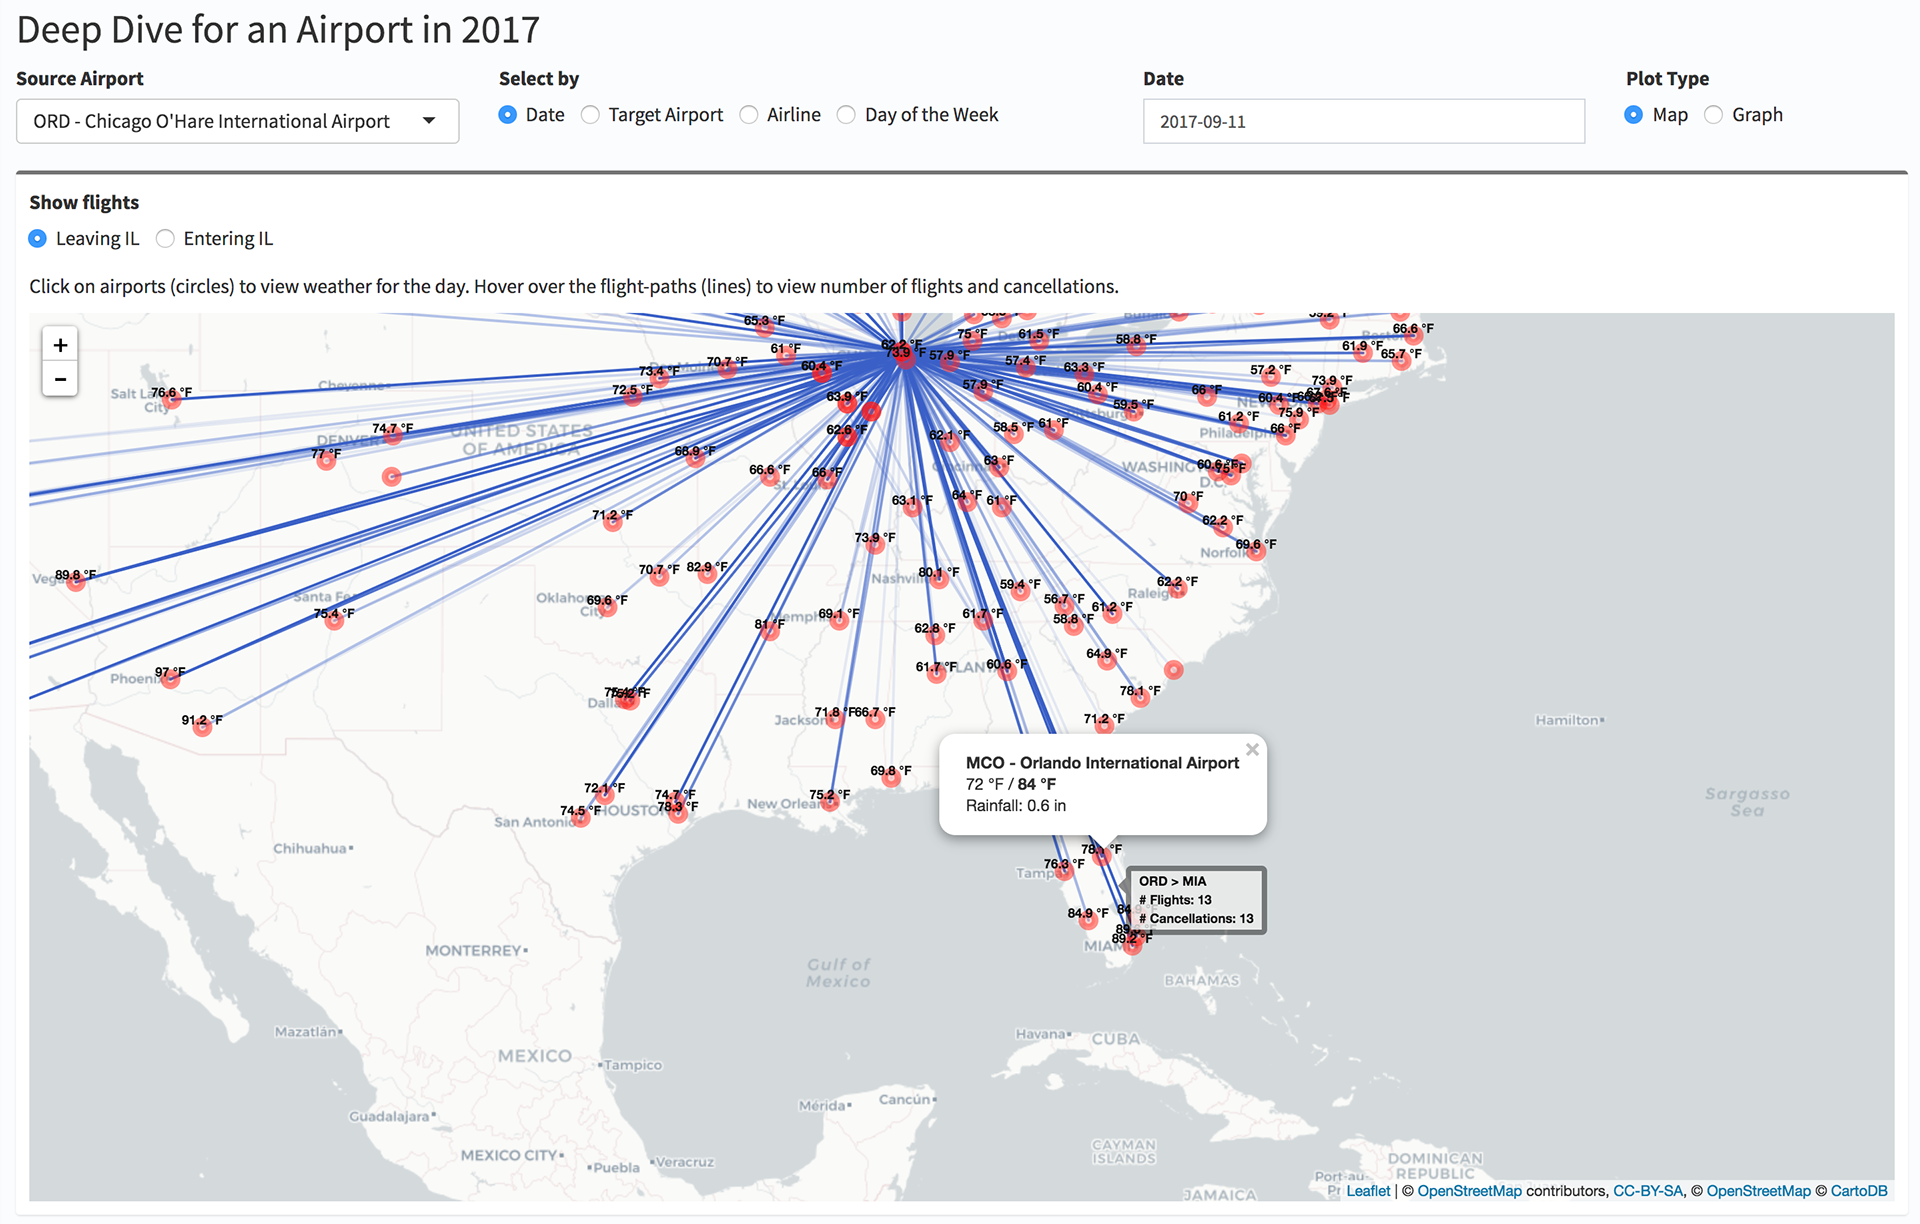
Flights to Florida cancelled due to hurricane Irma
MY ContributionS
Responsible for the presentation decisions including:
Application Layout
Color choices
Design Aesthetics
Scalability to desktop and size of 4080 by 2304
Team
Jaspreet Kaur Sohal
Amey Barapatre
Sai Phaltankar
Vivek R. Shivaprabhu